ORIGINAL
Coat genetic markers of the domestic cat Felis catus (Felidae) from southwestern Colombia
Marcadores genéticos del pelaje del gato doméstico Felis catus (Felidae) del suroccidente colombiano
Mauricio Peñuela A,1* M.Sc, Enrique Pardo P,2 Ph.D, Víctor Hugo García M,3 Ph.D, Heiber Cárdenas H,4 M.Sc.
1Universidad del Valle. Facultad de Ciencias Naturales y Exactas, Cali, Colombia. A.A. 25360.
2Universidad de Cárdoba. Departamento de Biología, Facultad de Ciencias, Montería, Colombia.
3Universidad del Quindío. Programa de Biología, Armenia, Colombia.
4Universidad del Valle. Departamento de Biología, Facultad de Ciencias Naturales y Exactas. Cali, Colombia. A.A. 25360.
*Correspondence: mauricio.penuela@hotmail.com
Received: April 2015; Accepted: January 2016.
ABSTRACT
Objective. Establish the genetic profiles of cats from 12 neighboring municipalities in southwestern Colombia, in a town course from Pereira-Popayán. Estimate the degree of diversity, genetic structure, and quantify gene flow. Materials and methods. Were inventoried the phenotypic markers present in the pigmentation and structure of the coat of 1482 cats of the municipalities surveyed. Based on these phenotypic frequencies, allele frequencies, heterozygosity, Hardy-Weinberg equilibrium, F statistics and Nei genetic distances were calculated. A comparison was also made between genetic and geographic distance matrices to determine if there was a significant association between the two. Results. With the genetic profiles of the populations we estimated the degree of diversity. We found the populations in equilibrium for the S autosomal locus and for the O sex-linked locus. We found a low level genetic structure, and it was determined that there was no significant correlation between the genetic and geographic distance matrices among populations. Conclusions. These findings can be explained on the basis of the processes of human displacement for this region, due to the fact that the establishment of feline populations in these municipalities originated during the same historical period. Identical genetic profiles are shared as a result of colonization events, and due to possible continued migration among these populations.
Key words: Historical migration, pigmentation genes, population genetics, regional scale (Source: CAB, DeCS).
RESUMEN
Objetivo. Determinar los perfiles genéticos de los gatos de 12 municipios contiguos del suroccidente colombiano en un trayecto Pereira-Popayán; estimar el grado de diversidad, estructura genética y cuantificar el flujo de genes. Materiales y métodos. Se inventariaron los marcadores fenotípicos presentes en la pigmentacián y estructura del pelaje de 1482 gatos de los municipios estudiados, con base en estas frecuencias fenotípicas se calcularon frecuencias alélicas, heterocigosidad, equilibrio Hardy-Weinberg, el estadístico FST y distancias genéticas de Nei. También se realizá una comparacián entre matrices de distancia genética y geográfica para determinar si existía asociacián significativa entre las dos. Resultados. Con los perfiles genéticos de las poblaciones se estimá el grado de diversidad, se hallá en equilibrio Hardy-Weinberg a las poblaciones para el locus autosámico S y el locus ligado al sexo O. Se encontrá bajo nivel de estructura genética y se determiná que no existe correlacián significativa entre las matrices de distancia genética y geográfica entre poblaciones. Conclusiones. Estos hallazgos se pueden explicar con base en los procesos de desplazamiento humano para esta regián, debido a que el establecimiento de poblaciones felinas en estos municipios se originá en el mismo período histárico. Se comparten perfiles genéticos idénticos como resultado, posiblemente, de eventos de colonizacián y migracián continua entre estas poblaciones.
Palabras clave: Escala regional, genes de pigmentacián, genética de poblaciones, migracián histárica (Fuente: CAB, DeCS).
INTRODUCTION
During the past century genetic coat markers in domestic cats Felis catus (Felidae) have become a useful tool to study the genetics of populations, since they have different types of heredity and genic actions such as epistasis and incomplete dominance that enriches the research. Recently, the genetic profiles of numerous American (1-4), European (5-8) and Asian (9) populations have been published. Based on an inventory of the allelic frequencies of the various loci that affect the color, pattern and length of the coat, we have been able to establish a hypothesis of historical migration through the world.
Genetic profiles of cat populations have served to assess the hypothesis of historical migration of colonial populations of cats during transcontinental events. We have studied the possible change in allele frequencies in cat populations among European countries with regard to their transoceanic colonies (2,10,11). In each case a differentiation has been observed between the allelic frequencies in populations of (European) origin and the resulting (colonies).
This study considers a hypothesis of historical migration in a more reduced geographical space in relation to the transoceanic migrations of European countries. Populations were studied from Pereira to Popayán, going through the Valle del Cauca, establishing the allelic frequencies in 12 municipalities and contrasting it with historical human migrations in Colombia. This region, where the study is conducted, is of great national economic development, due to its intense agricultural productivity, the industrial settlement and its large trade flow because of its proximity to the main Pacific port, Buenaventura.
All these factors have turned the biogeographical region of the Cauca River into a melting pot of various Colombian cultures that have probably affected the genetic profiles of cats in migratory events. Finally, the objectives of this investigation were: to identify, through coat genes, the domestic cat populations from 12 southwestern Colombian municipalities, to estimate the genetic structure degree of populations, and to determine if there was a correlation between geographic and genetic distances to contrast these results against historic human migration processes.
MATERIALS AND METHODS
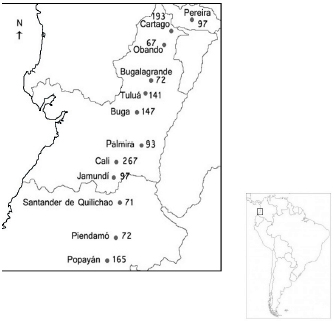
Sampling. A total of 1482 individuals were photographically sampled in 12 southwestern Colombian municipalities, encompassing three states covered by the region studied of the biogeographic valley of the Cauca river (Figure 1). Their genetic profiles were inventoried again, to determine if the cat populations of Cali and Popayán have changed their allelic frequencies throughout the years. Therefore, the number that goes with these cities indicates whether they have been in the first, second or third inventory. From 1482, 1060 were classified by gender; 46.32% were males and 56.67% females.
Figure 1. Map of southwestern Colombia depicting the locations of the study and their sample size.
In small municipalities, the sampling consisted of walks around town to enquire at each home, whether they had feline pets. For large cities the sampling was done by dividing the city into grids and the sampling sites were chosen at random. In households where the answer was affirmative, a request was made to photograph the animals and proceed to the collection of metadata such as sex, age (in months) and whether they were sterilized. In some municipalities visits were made to shelters or foundations sheltering abandoned pets. The corresponding photographic sampling was conducted. However, for these cases no metadata could be collected due to the lack of said data.
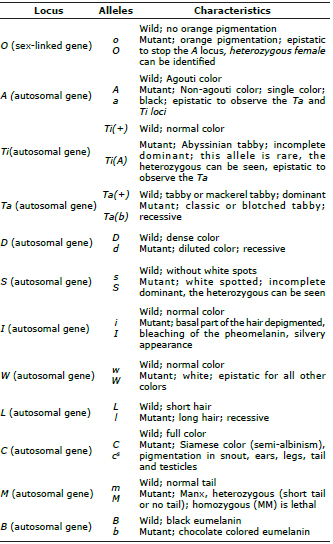
Identifying phenotypic markers. The genetic nomenclature used follows the Committee on Standardized Genectic Nomenclature for Cats (12) proposal, except for the chromosomic positions that make up the Tabby patterns, for which we followed Eizirik et al (13). The genes used for the genetic inventory of populations are listed in (Table 1).
Table 1. Description of the loci studied, modified from Ruíz-García (14).
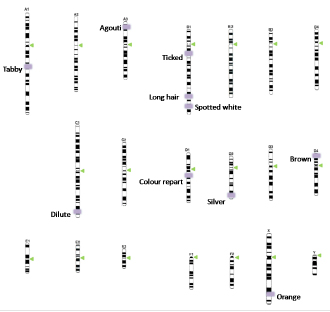
Research in the last decade has been able to identify the chromosomal positions of a great portion of the genes studied (14-22), reason why the classical phenotypic work has been transformed into a detailed inventory of genes, where chromosomes are converted into sampling units; in this article we develop a chromosomic ideogram of these genetic markers based on published information (Figure 2).
Figure 2. Karyotype of the domestic cat Felis catus, the chromosomal positions of the alleles were arranged based on the previously published information.
Data analysis.The calculation of the Hardy-Weinberg equilibrium was conducted on the O and S loci, on which it is possible to distinguish the heterozygous; in estimating O. Only individuals were used on which it was possible to identify their gender. Goodness of fit tests Chi-square(X2) was used for both O and S. The calculation of allele frequencies was conducted for loci with complete dominance assuming the Hardy-Weinberg equilibrium. For the sex-linked locus the expected values of male and Orange female were calculated with respect to the total number of males and females sampled.
The expected heterozygosity was calculated as (1-∑pi2) or (2pq) and the standard deviation of the allelic frequencies as (√(pq⁄2n)). We calculated the Wright index of FST differentiation from the O, a,Ta(b), d, S, I, W, l and cs genes (Table 2). The matrices obtained were computed in the Mega6 program (23) to generate dendrograms from Neighbor Joining algorithm. Dendrograms were also used to compare the study populations with Colombian populations previously inventoried, such as: Bogotá, Bucaramanga, Capurganá, Duitama, Ibagué, Pasto, Leticia, Leticia-Tabatinga and the previous samples from Cali and Popayán (Table 3). This table has the allelic frequencies and standard deviations of 11 morphological genes that affect the coat traits of F. catus, previously published in Colombia and the source data is listed in parenthesis. To test the hypothesis that the genetic distances of populations are correlated with geographic distances, the Mantel test was performed with 999 repetitions in the Gen ALEx program (24), using the FST matrices and Nei genetic distances (D) versus the geographical distance matrix calculated from the latitude and longitude of each municipality.
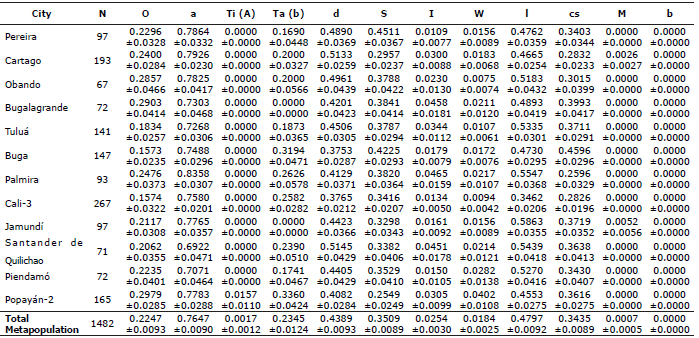
Table 2. Allelic frequencies and standard deviations of 12 morphological genes that affect coat characteristics of the F. catus in 12 municipalities in southwestern Colombia.
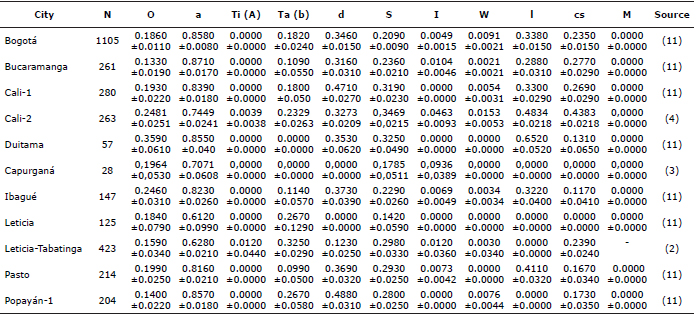
Table 3. Allelic frequencies and standard deviations of 11 morphological genes that affect coat characteristics of the F. catus, previously published for Colombia.
RESULTS
Table 2 shows the average allele frequencies of the loci studied with their standard deviations. The highest O allelic frequencies oscillated between 0.2979 and 0.1573; the allele a between 0.8358 and 0.6922. The Ti(A) allele was only detected in a heterozygous individual from Popayán-2 (0.0157). The Ta(b) allele was not found in any individual of Bugalagrande. The d allele showed a range of frequencies between 0.5145 and 0.3753, and the S allele between 0.4225 and 0.2549. The I allele showed lowest frequencies between 0.0465 and 0.0109. In addition, the W allele had low frequencies between 0.0282 and 0.0075. The l allele showed frequencies between 0.5863 and 0.3462; the cs allele between 0.45969 and 0.2596. The M allele was only observed in a heterozygous individual from Cartago (0.0026) and other from Jamundí (0.0052). Finally, the b allele was not found, the B allele was fixed in all populations. Overall, the highest expected heterozigosities were found in loci l (0.4992), d (0.4925) and S (0.4555) while lowest ones were found in M (0.0013), Ti(A) (0.0033) and W (0.0361).
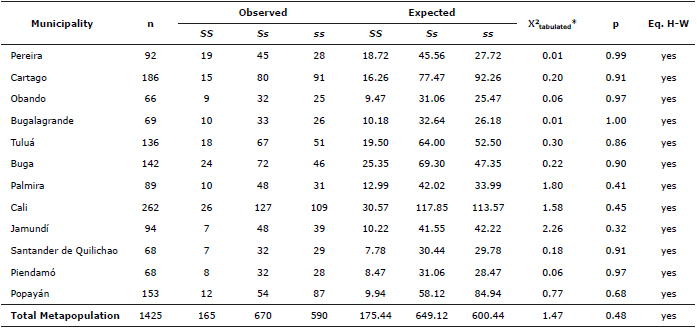
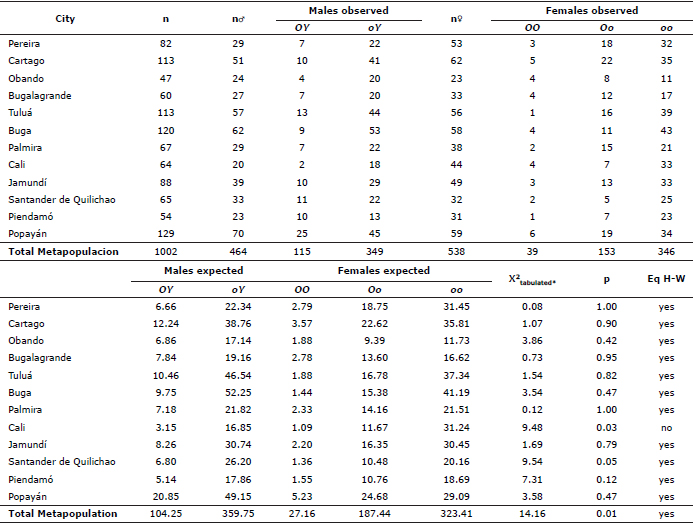
In each locality and in a mixed group, the Hardy-Weinberg equilibrium was estimated for the loci S and O. All assed populations did not show deviations from the Hardy-Weinberg equilibrium (Tables 4 and 5). However, to the O locus, the population mixed showed significant deviations from equilibrium (Table 5). This sample shows a homozygous excess and heterozygous deficiency, phenomenon known as the Whalund effect. This effect refers to the heterozygosity reduction in the total population caused by the structure of the populations. To know, whether two or more subpopulations have different allelic frequencies then the total heterozygosity it’s reduced, although subpopulations remain in the Hardy-Weinberg equilibrium.
Table 4. Chi-square to test the Hardy-Weinberg equilibrium hypothesis (Eq. H-W) in the S locus of F. catus in 12 municipalities in southwestern Colombia, n corresponds to the number of individuals surveyed for locus in each population. * X2 tabulated (2; 0.05) = 5.991.
Table 5. Chi-square to test the Hardy-Weinberg equilibrium hypothesis in the O locus of F. catus in 12 municipalities in southwestern Colombia, n corresponds to the number of individuals sampled. * X2 tabulated (4;0.05)=9.488.
The values obtained in the FST matrices and the Nei genetic distances (D) showed no significant correlation with the geographical distance matrix obtained from latitude and longitude data, Mantel test with 999 repetitions, FST (r2 =0.03 , p=0.08) and (D) of Nei (r2=0.00 , p=0.380).
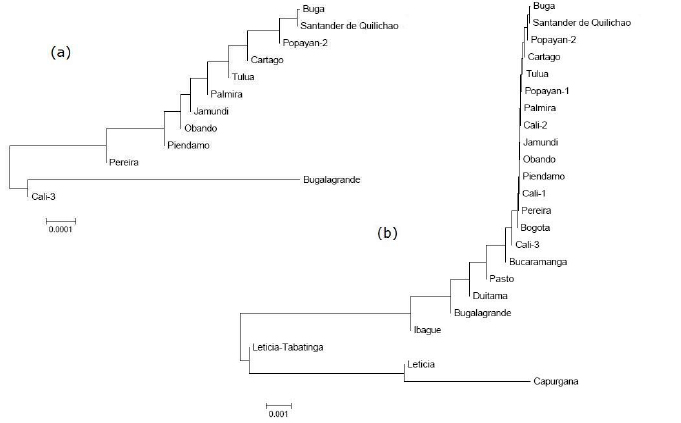
The dendrogram generated by the Neighbor joining algorithm, based on the FST values of the inventoried populations (Figure 3a), shows a grouping among the cities of Buga, Palmira, Obando, Pereira, Santander de Quilichao and Popayán-2. Out of this grouping, but close to it, we find Tuluá, which in turn is part of Cartago, the latter of Piendamá and Bugalagrande. Cali-3 exhibits the highest degree of differentiation placing itself on a distant branch outside the grouping, and Jamundí accompanies it in its separation, but does not form a solid grouping with Cali-3.
Figure 3. Dendrograms generated by the Neighbor joining algorithm on the basis of the values of FST for nine genes of F. catus, (a) in 12 municipalities in southwestern Colombia and (b) among populations of this study and Colombian populations previously inventoried.
The dendrogram generated with the same algorithm, but which compares the populations under study with other Colombian populations (Figure 3b), shows a solid grouping among the populations studied, including the previous genetic profiles of Cali-1, Cali-2 and Popayán-1. The other Colombian populations that do not belong to the biogeographical valley of the Cauca River shifted even further away from this grouping. And Leticia and Leticia-Tabatinga finally appear along with Capurgana with very different genetic profiles.
DISCUSSION
Care must be taken with these records since they were obtained under domestic conditions and are likely to differ from natural conditions or those lacking domestic care. However, the limited control by human beings over the choice of partners and the generation of litters with simultaneous fatherhoods, dramatically increase the genetic flow within populations, inbreeding reduces and increases panmixia.
The allelic frequencies of the twelve loci studied were very similar among the 12 populations (Table 2). The inventory of the highest allelic frequencies in dominant genes of low-penetrance such as: Ti(A), W, M in historically older populations, could genetically turn them into candidates as source populations of others. The elevated variation of the allelic frequencies present in the Ta(b) locus singles it as a useful locus in the differentiation between populations, followed by the O, d and l loci. The Ta(b) locus has been previously catalogued as one of the most heterogeneous markers, since its frequencies have helped differentiate populations of British origin from those of Iberian origin (10).
In this study we report the absence of the b allele in all populations evaluated, reason why the B allele is fixed in. Frequencies for b are reported in (4), in the subsampling done in southern Cali. However, this datum was an incorrect identification of an individual (A. Peña Com. Pers.). Therefore, no study has reported the presence of this allele in Colombian populations.
Like Peña et al (4), a decrease was found in the allelic frequencies of a and d for the population of Cali with respect to the first sampling performed by Ruíz-García y Álvarez (2). Both Tb(a) and I increased their allelic frequencies, agreeing with what was reported by Peña et al (4). The relevant differences between this study and Peña et al (4) are found in the values of O (0.1574 versus 0.2481), l (0.3462 versus 0.5165) and cs (0.2826 versus 0.4383). The allelic frequencies reported here for Cali-3 are more similar to those reported for Cali-1 according to Ruíz-García and Álvarez (2). Peña et al (4) justifies that the increase in these frequencies in Cali-2 can be attributed to the human selection of more attractive features (orange cats, with long hair or Siamese cats). We agree with this hypothesis, since the differences between the frequencies of these loci in Cali-2 and Cali-3 are surely due to the sampling design, since for Cali-2 we only sampled individuals in their homes, while for Cali-3 we sampled individuals in homes and shelters for abandoned animals. In contrast to Cali-2 Peña et al (4), the allele frequency for Ti(A) in Cali-3 is not reported here. It is not surprising, since only an individual in heterozygous state was inventoried, with a very low allele frequency (0.0039), and also the individual heterozygous reported in this study in Popayán-2 (0.0157).These results are consistent with our hypothesis that the inventory of the allelic frequencies in low-penetrance dominant genes such as: Ti(A), W, M in historically older populations, could genetically turn them into candidates as source populations of others.
It has been widely discussed that the presence of the Ti(A) allele in the continent, is due to the fact that there were trade routes between the ports of America in the Pacific and Asia, since the Ti(A) allele has the highest frequencies in southeast Asia (Southern coast of China, 0.20; Calcutta 0.37, Bombay 0.15, Colombo 0.30) (10,11). This would explain the presence of the allele in the population of Popayán, city that was one of the administrative centers of the Spanish Reign, and is also near the Pacific Ocean.
In the populations studied, we validated the existence of the Hardy-Weinberg equilibrium for the S locus and for O the locus using the method described by Christensen (25). (Tables 4 and 5), reason why we confirmed the stability of the allelic frequencies of these loci in the populations studied. Populations with demographic conditions with elevated effective numbers have proven to be highly stable over time (11).
The metapopulation(all mixed populations) exhibited no equilibrium in the O locus. Even though an autosomal locus such as S exhibits population balance, the calculation of the balance of the genes linked to sex is more sensitive due to the greater number of categories used by Chi-square. For the O locus, the mixed population did not behave as a panmictic unit, evidencing Whalund effect, heterozygous deficit or homozygous excess, indicating any degree of structure or population subdivision. The subjacent causes of this subdivision in the population could be geographic barriers at the gene flow followed by genetic drift in the subpopulations.
In comparison to other populations of this study, Cali-3 obtained the highest values of FST differentiation. This difference could be caused by permanent human migration, since this city is the current economic and political center of the region. According to the Mantel tests conducted on Wright’s FST matrix and on Nei’s genetic identity (D), none of these correlates with the geographical distance matrix calculated from latitude and longitude. This shows that current populations are not genetically similar among them due to geographical proximity, which disproves the hypothesis that constant gene flow due to geographical closeness had been the originator of the similarities in the genetic frequencies of the overall populations.
The Neighbor-joining dendrogram for the FST values, detects the formation of very solid groups among cities. In the first one, we observe a proximity among the majority of cities with the exception of Cali-3. Since this is the city that has historically received the largest migration of people, it could have considerably altered its population profile in comparison to the other populations (Figure 3a). In the dendrogram for the FST values among the populations studied and other Colombian populations, it is clear that a solid grouping is formed among populations belonging to the Colombian southwest, which are very different from populations such as Bucaramanga, Ibagué, Leticia and Capurganá, with Bogotá located near the southwest grouping, and Bugalagrande located away from it (this deviation is due to difference in frequencies of some loci e.g. ta(b)). Bogotá’s case is not surprising, even though it is located far from populations with similar genetic profiles. Its similarity can be historically justified by the continuous communication among the first cities founded in the new world. Even this group includes in its vicinity the previous genetic profiles of the cities of Cali and Popayán. This becomes strong proof that the populations of the Colombian southwest maintained a large genetic similarity, and it is very likely that they have historically originated by the same source population. But, to illustrate this hypothesis, it is necessary to first learn about the history of colonization of the region.
Between 1536 and 1537, Sebastián de Belalcázar arrived from Francisco Pizarro’s conquering mission, where he had founded the city of Quito in 1534, and founded the cities of Popayán, and Cali, after the subjugation of the indigenous tribes present in Popayán and in the place known as Jamundí today (26). Jamundí was founded in 1536 by Juan de Ampudia and Pedro Añazco, under orders from Sebastián de Belalcázar, who asked for the construction of a settlement to prepare for the foundation of Santiago de Cali.
During these years, Santander de Quilichao and Piendamá (26) were also founded. Marshal Jorge Robledo, who left Santiago de Cali on behalf Francisco Pizarro’s conquering mission, with precise orders to strengthen territorial control, founded the town of Cartago in 1540, in the place currently occupied by the city of Pereira. In 1540, Sebastián de Belalcázar was appointed governor of Popayán by King Carlos I of Spain. Belalcázar was also concerned about leaving a lasting mark on the conquered territories, to which end he brought barley, wheat and sugar cane seeds from Spain as well as numerous pets. After 1550, cattle and horses began to enter through Buenaventura, which led to the establishment of farms in the region (27).
During the colonial era, Santiago de Cali and Cartago were part of the government of Popayán, which in turn was part of the Royal Audience of Quito (26). Guadalajara de Buga was founded in 1554, but the city’s location changed 4 different times, until it finally settled in its current location. Tuluá was founded in 1539, and Bugalagrande in 1662, on land where the city of Buga had previously stood. Palmira was founded between 1680 and 1705 by the tenth century signed in Guadalajara de Buga. The transfer of Cartago to its current location on the plains of Valle del Cauca took place in the year 1691. In 1863, the ruins of the old Cartago were reconquered and it gave birth to the city of Pereira. The re-population of these lands was greatly influence by the Antioquia colonization, as well as the foundation of Obando in 1890.
The historical account that gave rise to the cities of the Colombian southwest enables us to understand the great genetic similarity among the cat populations. Here the hypothesis of a common genetic population as the origin of the other populations, finds strong foundations thanks to the history of cities of the region. The municipalities of Popayán, Cali and Cartago were the territorial administrative centers of Spain during the colonial era in the biogeographical valley. By being the only population present at the time, the flow of inhabitants and their pets must have been permanent, added to the fact that these municipalities belonged to the same government.
The territorial flourishing of these populations and their constant communication through the Cauca river channels, could have allowed the establishment of a similar genetic profile among the source populations that would give rise to the rest of subsequent populations. This hypothesis could find support in the inventory of the highest dominant allele frequencies in low penetrance genes such as: Ti(A), W, M, in historically older populations. Thus the allele Ti(A) only was inventoried in heterozygous state in the municipality of Popayán-2, where the highest W frequencies of were also found. The M allele was only found in the municipalities of Jamundí and Cartago, obviously in heterozygous state, due to the lethal condition of its homozygosity. The inventory of these allelic frequencies offers a greater genetic diversity to these populations, because it sets them up to be strong candidates as mother populations.
Let us remember that (2,10,11) group, in their analysis, the populations of Cali, Popayán, Buenos Aires, California and Colorado in the same gene pool. This grouping reveals the connection through maritime trade routes in the Pacific, reason why they are genetically similar and have a common genetic origin of Hispanic origin (10).
The genetic profiles of populations after the colonial era were probably caused by geographically nearby cities, which is supported in some groupings formed by dendrograms. Cali’s genetic distancing can be explained by the events of the past centuries. This city became the engine of economic development in the region, because of its proximity to the port of Buenaventura. This economic prosperity really contributed to the massive migration of people from all over the region, which will certainly affected the genetic profile of the cat populations, but did not markedly differentiate it from the original genetic block.
It is clear that the origin of the genetic profiles of southwestern Colombian domestic cats presents a common historical origin that has generated little differentiation over time, and that genetically separates them from the remaining Colombian populations. The rapid population growth of the species and the minimal human control over their reproduction greatly increases gene flow and increases panmixia, key conditions to keep to a minimum the variation in genetic frequencies.
Acknowledgments
To Luz ClemenciaAristizábal for her unconditional support during the entire project.To Fanny Aristizábal, Carlos Alberto Duque, Teresa de Jesús Gámez, Leonardo Granobles, Einer Orozco, Esteffania Carvajal, Juan David Guevara, Amparo Aristizábal, Yenifer Escobar, Sofía Úsuga, Diana Carabalí, Johana Pérez, Maurissio Bedoya and theenthusiasticstudents of (GETEG).
REFERENCES
1. Shostell JM, Staudinger J, Ruiz-Garcia M. Mutant allele frequencies in domestic cat populations in Arkansas and Tennessee. J Hered 2005; 96(5):557-565.
2. Ruiz-García M, Álvarez D. A biogeographical population genetics perspective of the colonization of cats in Latin America and temporal genetic changes in Brazilian cat populations. Gen Mol Biol 2008; 31(3):772-782.
3. Peñuela M, Cárdenas H. Marcadores genéticos del pelaje en gatos domésticos de Capurganá-Colombia. Mom Cien 2012; 9(1):28-33.
4. Peña-Cruz AF, Sandoval S, Patiño A, Bedoya M, Rodríguez A. Orjuela J et al. Genetic analysis of the cat population of north and south of Cali, Colombia. Acta Biolo Colomb 2015; 20(1):109-116.
5. Golubeva NA, Zhigachev AL. New data on coat color gene frequencies in catas: 1 the Armavir population. Russ J Genet 2007; 43(8): 894-898.
6. Goncharenko GG, Zyat′kov SA, Lysenko AN. Genetic structure and level of differentiation in Felis catus populations of the European continent. Dokl Biol Sci 2010; 431:135-138.
7. Goncharenko GG, Zyat′kov SA. The level of genetic differentiation in cats (Felis catus L.) in western European, North American, and Eastern European populations. Russ J Genet 2012; 2(1):47-52.
8. Kholin SK. New data on coat color mutant gene frequencies in domestic cats of the European part of Russia (the city of Kamyshin). Russ J Genet 2012; 48(7):751-754.
9. Kholin SK. New data on coat color mutant gene frequencies in domestic cats of Kholmsk (Sakhalin Island). Amurian Zoological Journal 2013; V(4):473-475.
10. Ruiz-García M, Álvarez D, Shostell JM. Population genetic analysis of cat populations from Mexico, Colombia, Bolivia, and the Dominican Republic: identification of different gene pools in Latin America. J Genet 2005; 84(2):147-17.
11. Ruiz-García M, Álvarez D. Análisis filogenético de 21 poblaciones latinoamericanas de gatos, mediante 10 loci morfolágicos, utilizando métodos de matrices de distancias genéticas y de máxima parsimonia. Bol R Soc Esp Hist Nat Secc Biol (Sec Biol) 1999:139-164.
12. Committee on Standardized Genetic Nomenclature for Cats. Standardized genetic nomenclature for the domestic cat. J Hered 1968; 59:39-49.
13. Eizirik E, David VA, Buckley-Beason V, Roelke ME, Schäffer A, Hannah SS et al. Defining and Mapping Mammalian Coat Pattern Genes: Multiple Genomic Regions Implicated in Domestic Cat Stripes and Spots. Genetics 2010; 184:267-275.
14. Ruiz-Garcia M. Genetic structure of the Marseilles cat population: is there really a strong founder effect?. Genet Sel Evol 1994; 26: 317-331.
15. Lyons LA, Foe IT, Rah HC, Grahn RA. Chocolate coated cats: TYRP1 mutations for brown color in domestic cats. Mamm Genome 2005; 16(5):356-366.
16. Cooper MP, Fretwell N, Bailey SJ, Lyons LA. White spotting in the domestic cat (Felis catus) maps near KIT on feline chromosome B1. Anim Genet 2006; 37(2):163-165.
17. Ishida Y, David VA, Eizirik E, Schäffer AA, Neelam BA, Roelke ME et al. A homozygous single-base deletion in MLPH causes the dilute coat color phenotype in the domestic cat. Genomics 2006; 88(6):698-705.
18. Kehler JS, David VA, Schäffer AA, Bajema K, Eizirik E, Ryugo DK et al. Four independent mutations in the feline fibroblast growth factor 5 gene determine the long-haired phenotype in domestic cats. J hered 2007; 98(6):555-66.
19. Menotti-Raymond M, David VA, Eizirik E, Roelke ME, Ghaffari H, O’Brien SJ. Mapping of the domestic cat ″SILVER” coat color locus identifies a unique genomic location for silver in mammals. J hered 2009; 100 Suppl (Supplement 1):S8-13.
20. Menotti-Raymond M, David VA, Schäffer AA, Tomlin JF, Eizirik E, Philip C et al. An autosomal genetic linkage map of the domestic cat, Felis silvestris catus. Genomics 2009; 93(4):305-313.
21. Schmidt−Küntzel A, Nelson G, David VA, Schäffer AA, Eizirik E, Roelke ME et al. A domestic cat X chromosome linkage map and the sex-linked orange locus: mapping of orange, multiple origins and epistasis over nonagouti. Genetics 2009; 181(4):1415-1425.
22. Eizirik E, Yuhki N, Johnson WE, Menotti-Raymond M, Hannah SS, O’Brien SJ. Molecular genetics and evolution of melanism in the cat family. Curr biol 2003; 13(5):448-53.
23. Tamura K, Stecher G, Peterson D, Filipski A, Kumar S. MEGA6: Molecular Evolutionary Genetics Analysis version 6.0. Mol Biol Evol 2013; 30:2725-2729.
24. Peakall R, Smouse PE. GenALEx 6.5: genetic analysis in Excel. Population genetic software for teaching and research-an update. Bioinformatics 2012; 28:2537-2539.
25. Christensen A. Cats as an Aid to Teaching Genetics. Genetics 2000: 155(3):999-1004.
26. Henao JM, Arrubla G. Historia de Colombia para la enseñanza secundaria. Librería Colombiana, C. Roldán & Tamayo. 1920. 592p.
27. Padilla S, Lápez M, González L. La encomienda en Popayán: tres estudios. Sevilla, España; Consejo Superior de investigaciones Científicas: 1977.