Investigación de la clasificación de máquinas de vectores de soporte en la estimación del área de bosques caducifolios latifoliados en el norte de Irán
Investigation of classification of support vector machine on the estimation of the deciduous broad-leaved forests area in the north of Iran


Esta obra está bajo una licencia internacional Creative Commons Atribución-NoComercial 4.0.
Mostrar biografía de los autores
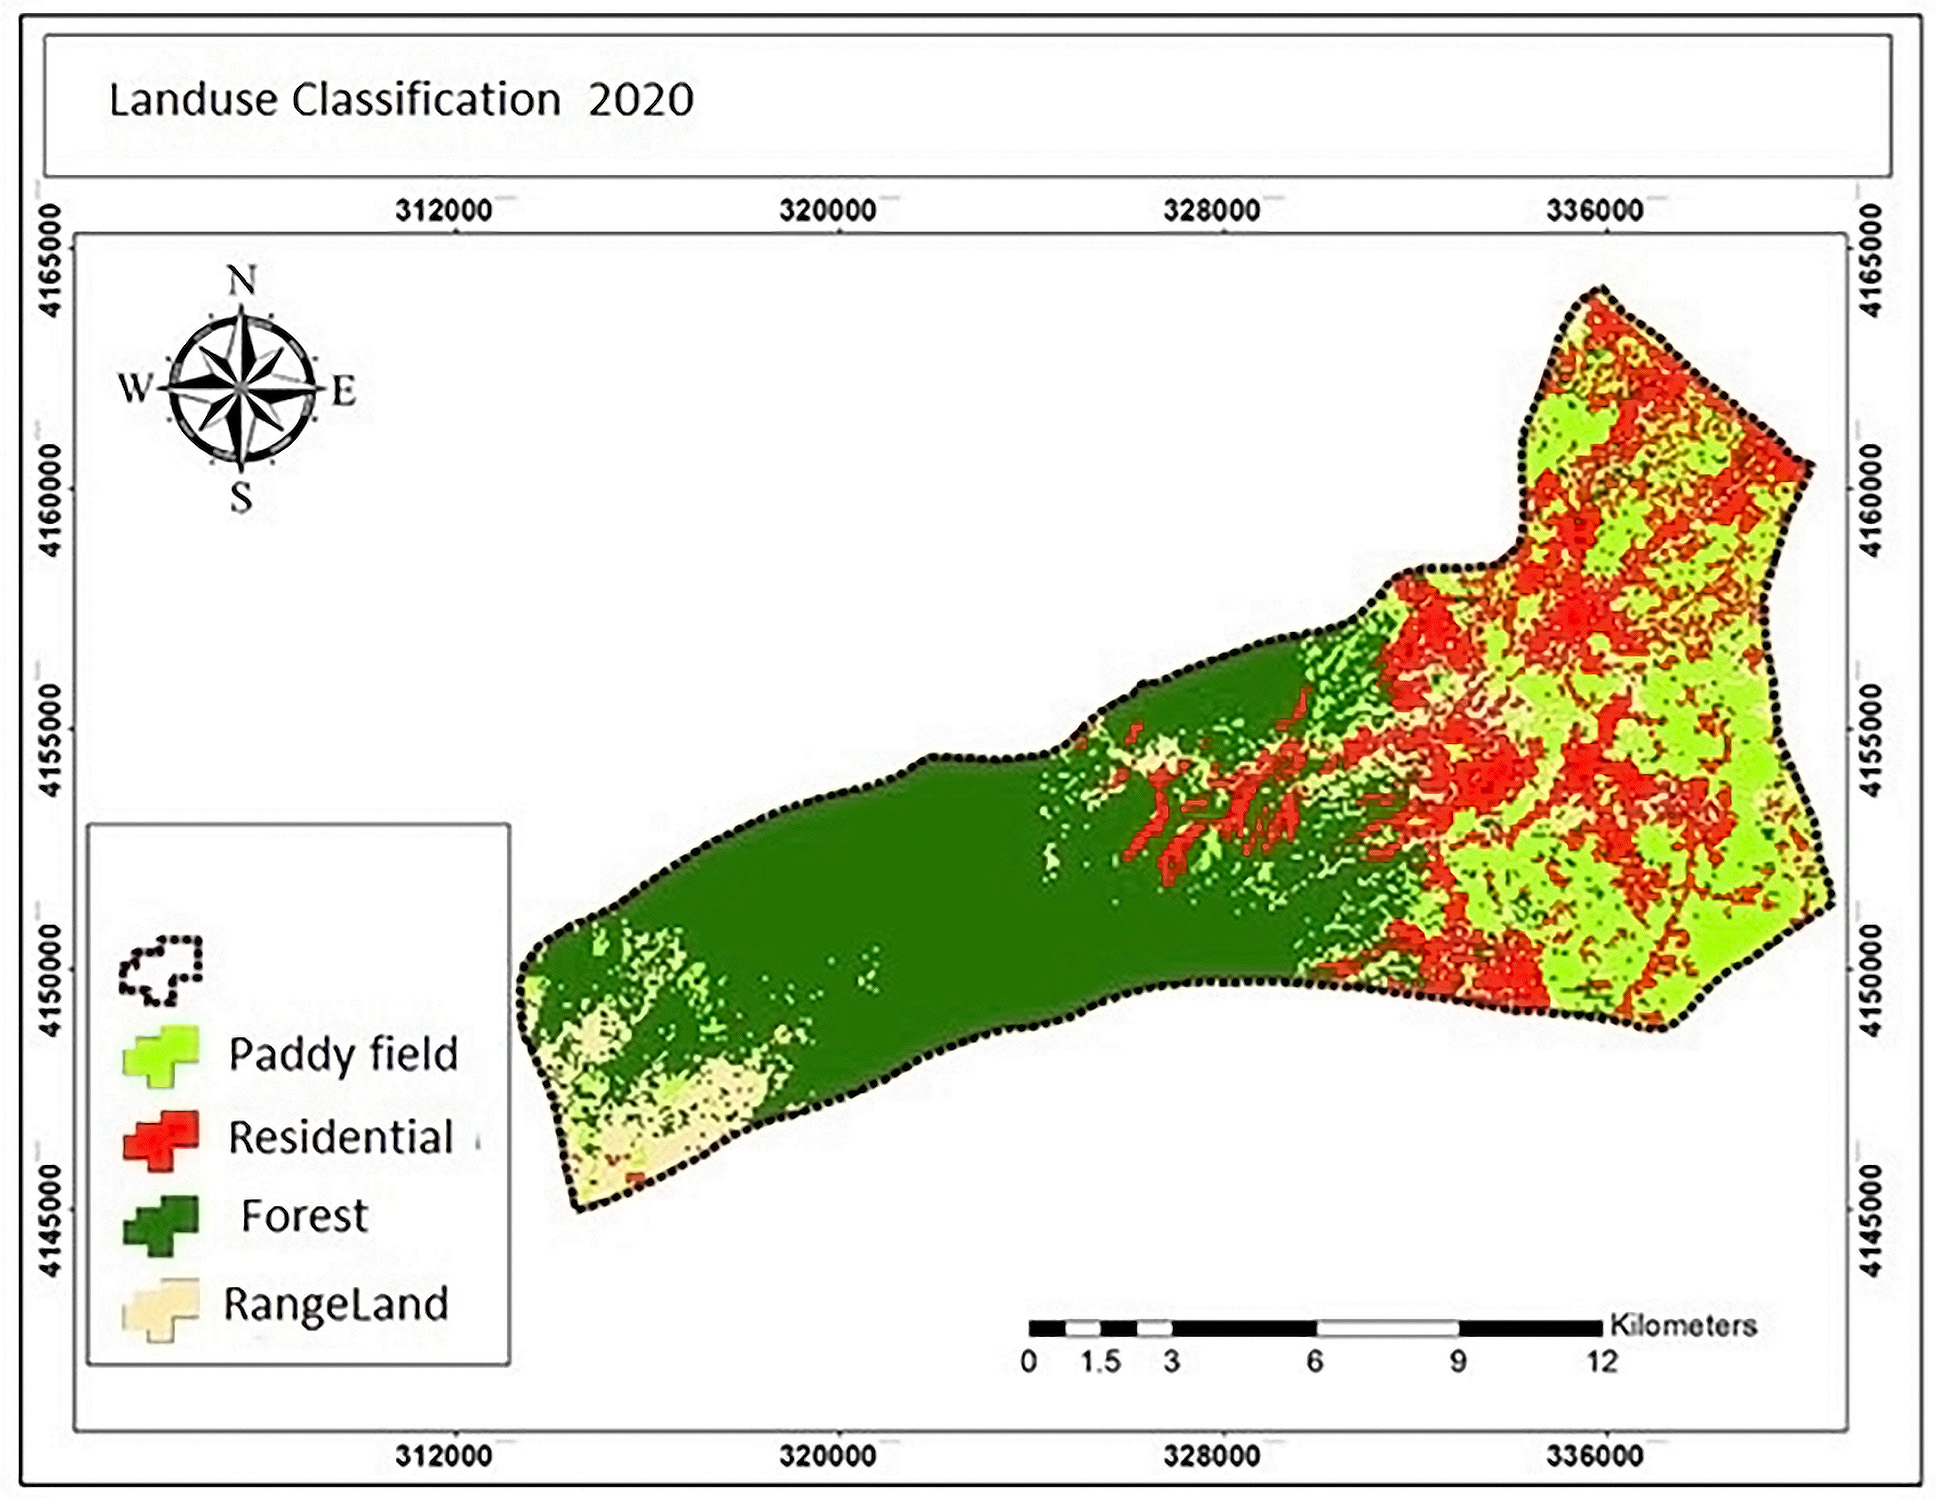
Durante las últimas décadas, los bosques del Caspio han sido atacados por la interferencia humana. El fácil acceso, la abundancia y diversidad de valiosos productos forestales han provocado el aumento de la densidad poblacional, la creación de nuevas zonas residenciales y la actividad de deforestación. Revelar los cambios es uno de los métodos básicos en la gestión y evaluación de los recursos naturales. El propósito de este estudio es estimar el área forestal utilizando un modelo de clasificación de máquinas de vectores de soporte en imágenes de satélite Landsat 8 en los bosques de Shafarood de la provincia de Gilan. Los resultados de la clasificación de imágenes en el método de la máquina de vectores de soporte mostraron que el área del bosque en 2010 era igual a 12104,64 hectáreas, la cual ha llegado a 9478,69 hectáreas en 2020, es decir, su superficie ha disminuido en 2625,95 hectáreas debido a cambios en su uso y su conversión a uso residencial y pastizales pobres. Con su crecimiento en los años 2010 a 2020, el uso residencial ha pasado de 1385,1 a 2542,35, es decir, la superficie ha aumentado en 1157,25 hectáreas. Los cambios en el uso de los pastos también han supuesto un aumento de 2.707,74 a 4.478,17 hectáreas, es decir, 1.770,43. La razón del aumento de este uso puede afirmarse que muchas partes del uso forestal se han convertido en pastizales pobres. De acuerdo con el coeficiente Kappa y la precisión global obtenida por la clasificación de la máquina de vectores de soporte en 2010 y 2020, para 2010 se obtuvo 95,76 y 91,75% y 99,72 y 99,62% en 2020. Los resultados mostraron que el método de la máquina de vectores de soporte tuvo una mayor exactitud en la separación de usos.
Visitas del artículo 106 | Visitas PDF
Descargas
- Afify. H.A. 2011. Evaluation of change detection techniques for monitoring land-cover changes: A case study in new Burg El-Arab area, Vol 50, No 2, P 187-195.
- Bauer, T. and Steinnocher, K. 2001. Per-parcel Land Use Classification in Urban Areas Applying a Rule-based Technique, GeoBIT/GIS, Vol. 6, pp. 24-27
- Cervantes, J., Garcia-Lamont, F., Rodriguez-Mazahua, L. and Lopez, A. 2020. A comprehensive survey on support vector machine classification: Applications, challenges and trends.Neurocomputing, no. 408:189-215.
- Chen, D., Stow, D.A. and Gong, P. 2004. Examining the Effect of Spatial Resolution and Texture Window Size on Classification Accuracy: An Urban Environment Case, International Journal of Remote Sensing, Vol. 25 (11): 2177-2192.
- Cihlar, J. and Jansen, L.J.M. 2001. From Land Cover to Land Use: A Method for Efficient Land Use Mapping Over Large Areas, Professional Geographer, Vol. 53, No. 2, pp. 275-289.
- Fazli Farsani, A., Qadawi. R., and Farzaneh. M. 2014. Investigating the performance of land use classification algorithms using image fusion techniques (case study: Beheshtabad sub-basin), Journal of Remote Sensing and Geographical Information System in Natural Resources, 6(1): 91- 106.
- Gholoobi, M., Tayyebi, A., Taleyi, M. and Tayyebi, A.H. 2010.Comparing Pixel Based and Object Based Approaches in Land Use Classification in Mountainous Areas. International Archives of the Photogrammetry, Remote Sensing and Spatial Information Science, Volume XXXVIII, Part , Kyoto Japan 2010, Commission WG VIII/8 ˚ Land, PP. 789-794.
- Herold, M., Scepan, J., Müller, A. and Günther S. 2002. Object-oriented Mapping and Analysis of Urban Land use/cover Using IKONOS Data, Proceedings of 22nd EARSEL Symposium Geoinformation for European, wide integration, Prague, June.
- Higginbottom, T.P., Collar, N.J., Symeonaki, E. and Marsden, S.J. 2019. Deforestation dynamics in an endemic-rich mountain system: Conservation successes and challenges in West Java 1990–2015. Biological Conservation, 229: 152-159.
- Hilbert, D.W. and Ostendorf, B. 2001. The utility of artificial neural networks for modeling the distribution of vegetation in past, present and future climates. Ecological Modeling, 146:311-327.
- Ingram, J.C., Dawson, T.P. and Whittaker, R.J. 2005. Mapping tropical forest structure in southeastern Madagascar using remote sensing and artificial neural networks. Remote Sensing of Environment, 94:491-507.
- Jain, R. K. and Jain, K. 2017. Modeling Urban Land Cover Growth Dynamics Based on Land Change Modeler (LCM) Using Remote Sensing: A Case Study of Gurgaon, India, Advances in Computational Sciences and Technology, ISSN 0973 -6107. 10 (10): 2947-2961.
- Kazeminia, A., Rangzan, K. and Mahmoud Abadi, M. 2016. Studying the severity of desertification using the Medalus model (case study: West Ahvaz lands), Journal of Remote Sensing and Geographical Information System in Natural Resources, 8(2): 111-126.
- Lackner, M. and Conway, T.M. 2008. Determining Land-use Information from Land Cover Through an Object-oriented Classification of IKONOS Imagery, Canadian Journal of Remote Sensing 34 (2): 77-92.
- Liu, T. and Yang, X. 2015.Monitoring land changes in an urban area using satellite imagery, GIS and landscape metrics. Applied Geography, 56: 42-54.
- Longley, P.A. and Mesev, V. 2000. On the measurement and generalization of urban form. Environment and Planning A, 32(3):473-488.
- Lu, D., Mausel, P., Brondi´zio, E. and Moran, E. 2004. Change detection techniques. INT. J. REMOTE SENSING, JUNE 20, 2004, VOL. 25, NO. 12, 2365–2407.
- Mather, P.M. 2005. Computer processing of remotely-sensed images, Third Edition, John iley and Sons, Ltd, 319p.
- Mohammadi, S.H., Habashi, K.H. and Pourmanafi, S. 2017. Monitoring and forecasting changes in land use/cover and its relationship with drought (Case study: sub-basin of Parcel B2, Zaindeh Rood watershed). Journal of Remote Sensing and Geographical Information System in Natural Resources, 9(1): 24-39.
- Rafiei, R. M., Abdul Rasul, S. and Khorasani, Nemat, E. 2018. Determining land use changes by comparison method after classification of IRS and LandSat satellite images, Journal of Remote Sensing and GIS Application in Natural Resources Sciences, 3: 53-61.
- Richards, J. A. and Richards, J. A. 1999. Remote sensing digital image analysis. 3: Springer.
- Samadzadegan, F. and Mahmoudi F. 2014. Data integration in remote sensing and concepts and methods. Publishing Institute, University of Tehran. 312.
- Stehman, S.V. 2004. A critical evaluation of the normalized error matrix in map accuracy assessment. Photogrammetric Engineering and Remote Sensing, 70: 743-751.
- Sugumaran, R. 2001. Forest Land Cover Classification Using Statistical and Artificial Neural Network Approaches Applied to IRS LISS - III Sensor, Geocarto International, Vol. 16, No. 2, pp. 39-44.
- Swetanisha, S., Amiya, R. and Dayal, K. 2022. Land use/land cover classification using machine learning models. International Journal of Electrical & Computer Engineering., 12 (2) : 2040-2046.
- Wu, Q. Li, H.Q. Wang, R.S., Paulussen, J., He, Y., Wang, M., Wang, B.H. and Wang Z. 2006. Monitoring and predicting land use change in Beijing using remote sensing and GIS. Landscape and Urban Planning, 78(4): 322-333
- Zhao, G. X., Lin, G. and Warner, T. 2008.Using the maticmapper data for change detection and sustainable use of cultivated land: A case study in the Yellow river delta, China", International Journal of Remote Sensing, 25 (13): 25-40.


Palabras clave
Código QR